Measuring mobile performance with EAS Observe
I’ve been playing around with Expo’s newly released EAS Observe, and this is probably one of my favourite additions to EAS recently.
One thing I’ve always found tricky with mobile app performance is the difference between an app feeling fast during development and knowing how it actually performs once it’s running on real devices.
With EAS Observe, I can now start putting numbers behind that. I’ve been able to see metrics like:
- Cold and warm launch times
- Time to First Render (TTR)
- Time to Interactive (TTI)
- OTA update download times
- Performance across different builds and updates
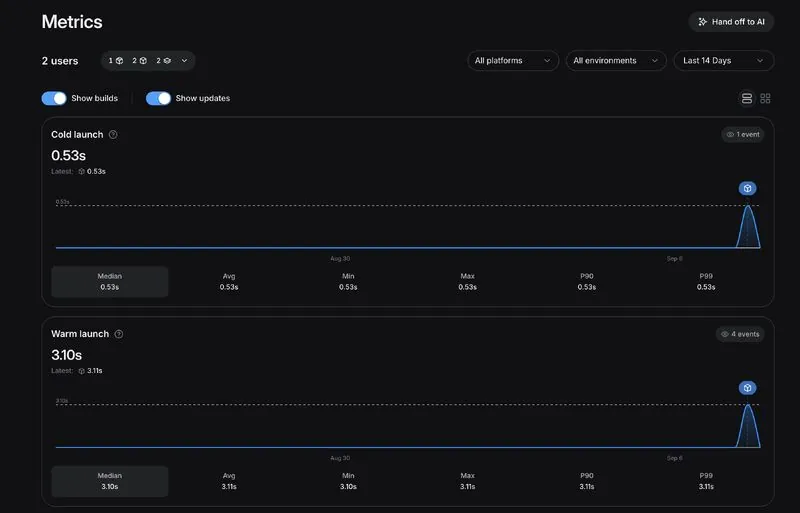
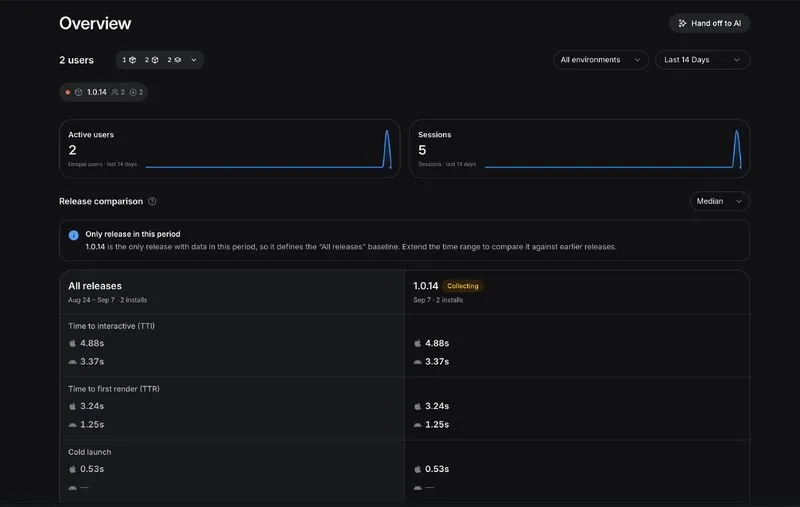
And I think that’s the part I’m most excited about. It’s one thing to open your app during development and think, “yeah, this feels fast.” It’s another to see the actual numbers and eventually be able to tell whether a change improved performance or introduced a regression.
I’m still testing this on our staging build, so there’s not enough data yet to draw any real conclusions from the numbers. Moving it to production next, and that’s where I’m particularly interested to see what the metrics look like with more real-world usage across different devices.
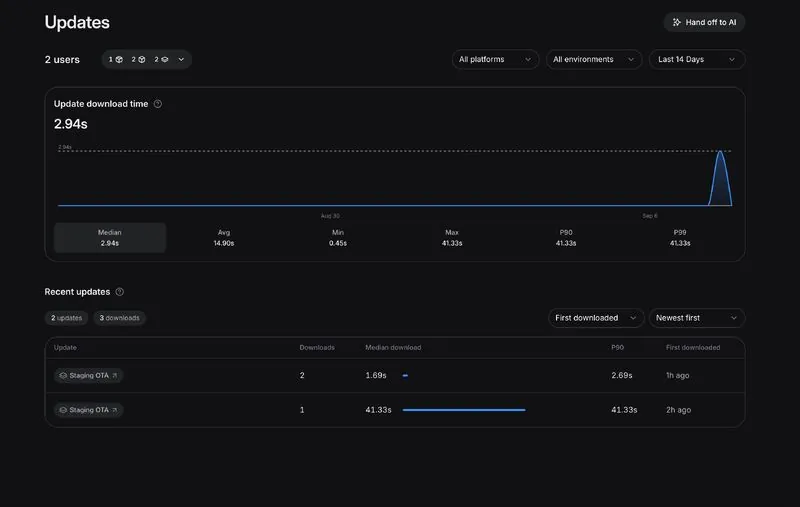
For now, I’m just happy to have better visibility into something that previously involved a lot more guesswork. Definitely going to be paying more attention to these metrics when optimizing and shipping updates going forward.
Originally shared on LinkedIn.